AWR mining – I/O wait histograms
UPDATE: July 12, 2011 I just noticed (!) that the DBA_HIST_EVENT_HISTOGRAM is only on 11g, so for 10g, it requires collecting the histogram deltas manually off of V$EVENT_HISTOGRAM, something like
set pagesize 150
col event format a25
col tm format a14
select event,
       to_char(sysdate,'J')||to_char(round(sysdate-trunc(sysdate),5)) tm,
       wait_time_milli,
       wait_count
from v$event_histogram
where event in ('log file parallel write' ,
                'db file scattered read' ,
                'db file sequential read' )
order by event;
and collecting this information every N seconds and taking the deltas. Also if you want the buckets in columns instead of rows:
select
    event,
    to_char(sysdate,'J')||to_char(round(sysdate-trunc(sysdate),5)) tm,
    sum (case when WAIT_TIME_MILLI=1 then WAIT_COUNT else 0 end) b1,
    sum (case when WAIT_TIME_MILLI=2 then WAIT_COUNT else 0 end) b2,
    sum (case when WAIT_TIME_MILLI=4 then WAIT_COUNT else 0 end) b3,
    sum (case when WAIT_TIME_MILLI=8 then WAIT_COUNT else 0 end) b4,
    sum (case when WAIT_TIME_MILLI=16 then WAIT_COUNT else 0 end) b5,
    sum (case when WAIT_TIME_MILLI=32 then WAIT_COUNT else 0 end) b6,
    sum (case when WAIT_TIME_MILLI=64 then WAIT_COUNT else 0 end) b7,
    sum (case when WAIT_TIME_MILLI=128 then WAIT_COUNT else 0 end) b8,
    sum (case when WAIT_TIME_MILLI=256 then WAIT_COUNT else 0 end) b9,
    sum (case when WAIT_TIME_MILLI=512 then WAIT_COUNT else 0 end) b10,
    sum (case when WAIT_TIME_MILLI=1024 then WAIT_COUNT else 0 end) b11,
    sum (case when WAIT_TIME_MILLI=2048 then WAIT_COUNT else 0 end) b12,
    sum (case when WAIT_TIME_MILLI=4096 then WAIT_COUNT else 0 end) b13,
    sum (case when WAIT_TIME_MILLI=8192 then WAIT_COUNT else 0 end) b14,
    sum (case when WAIT_TIME_MILLI=16384 then WAIT_COUNT else 0 end) b15,
    sum (case when WAIT_TIME_MILLI=32768 then WAIT_COUNT else 0 end) b16,
    sum (case when WAIT_TIME_MILLI=65536 then WAIT_COUNT else 0 end) b17,
    sum (case when WAIT_TIME_MILLI=131072 then WAIT_COUNT else 0 end) b18,
    sum (case when WAIT_TIME_MILLI=262144 then WAIT_COUNT else 0 end) b19,
    sum (case when WAIT_TIME_MILLI=524288 then WAIT_COUNT else 0 end) b20,
    sum (case when WAIT_TIME_MILLI=1048576 then WAIT_COUNT else 0 end) b21,
    sum (case when WAIT_TIME_MILLI=2097152 then WAIT_COUNT else 0 end) b22,
    sum (case when WAIT_TIME_MILLI=4194304 then WAIT_COUNT else 0 end) b23,
    sum (case when WAIT_TIME_MILLI > 4194304 then WAIT_COUNT else 0 end) b24
from v$event_histogram
where event='log file parallel write'
group by event,to_char(sysdate,'J')||to_char(round(sysdate-trunc(sysdate),5)) ;
Exploring I/O histogram values in AWR. In the AWR repository I have several databases, all reading off the same LUNs, so below I try to take the deltas between each snapshot and sum up all the waits for each bucket in the histogram
set pagesize  50000
set feedback off
set echo off
SET markup HTML on
spool hist.html
with hist as  (
  select
       sn.snap_id,
       sn.dbid,
       to_char(trunc(cast(begin_interval_time as date ))+
         (ROUND ((cast(begin_interval_time as  date) -
         TRUNC (cast(begin_interval_time as date))) * 24) / 24),
        'YYYY/MM/DD HH24:MI') btime,
       h.event_name,
       h.wait_time_milli,
       h.wait_count
  from dba_hist_event_histogram  h,
       dba_hist_snapshot sn
  where
         h.instance_number = 1
     and sn.instance_number = 1
     and h.event_name like 'db file seq%'
     and sn.snap_id=h.snap_id
     and sn.dbid=h.dbid
   )
select  a.btime,
        a.wait_time_milli,
        sum(b.wait_count - a.wait_count)
from hist a,
     hist b
where a.dbid=b.dbid
  and a.snap_id=b.snap_id-1
  and a.wait_time_milli = b.wait_time_milli
group by a.btime, a.wait_time_milli
having  sum(b.wait_count - a.wait_count) > 0;
spool off
SET markup HTML off
With the HTML output it’s easy to read into excel.
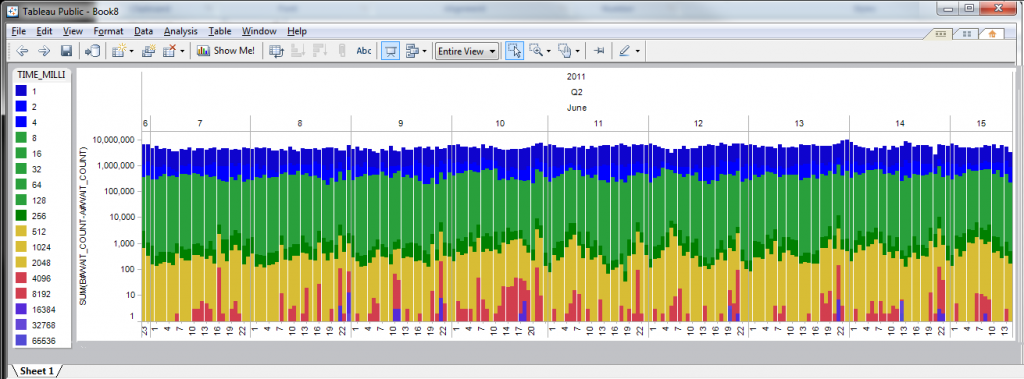
The data can be graphed in Excel using pivot tables or pivot charts, but if I simply save the data in an excel worksheet, then I can open it up in Tableau, which in some circumstances, can be easier to use than excel
The Y axis is in log scale. I don’t find that the data speaks to me immediately (other than there are some seriously slow I/Os) but it is easy to see the major outliers.
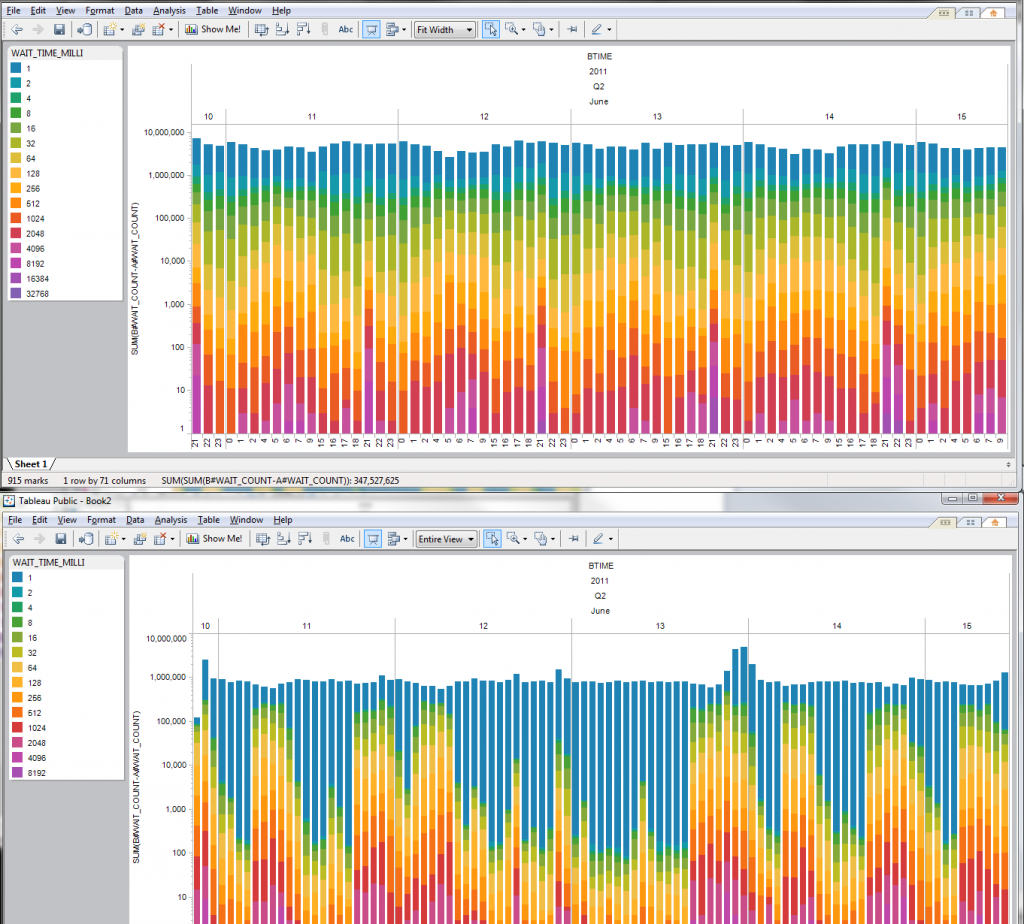
UPDATE:
One advantage of Tableau is the easy color coordination. Using the “cyclic” pallet, the colors come out pretty good for the I/O histograms (this would be time consuming on Excel)


Trackbacks
Comments
Nice,
I have to test this one on one DB to see what I get.
I get graphs from other views, but I still have not done anything with dba_hist_event_histogram