Highchart and JSON fun
Anyone want to look through the following JSON and spot the problem?
{{“o_w_ms”:[[1313412960000 , 1.71 ],[1313413020000 , 2 ]], “o_w_sz”:[[1313412960000 , 0 ],[1313413020000 , 0 ]], “o_w_MBt”:[[1313412960000 , 0.01 ],[1313413020000 , 0.01 ]], “o_r_ms”:[[1313412960000 , 0.04 ],[1313413020000 , 0.36 ]], “o_r_sz”:[[1313412960000 , 0 ],[1313413020000 , 0 ]], “o_r_MBt”:[[1313412960000 , 0.05 ],[1313413020000 , 0.05 ]], “D_W_IO_ms”:[[1313412960000 , 0.17 ],[1313413020000 , 0.15 ]], “D_W_NFS_ms”:[[1313412960000 , 0.66 ],[1313413020000 , 0.62 ]], “D_W_NFS_sz”:[[1313412960000 , 12 ],[1313413020000 , 18 ]], “D_W_NFS_MB”:[[1313412960000 , 0.02 ],[1313413020000 , 0.03 ]], “D_W_IO_MB”:[[1313412960000 , 0.28 ],[1313413020000 , 0.33 ]], “D_R_NFS_ms”:[[1313412960000 , 0 ],[1313413020000 , 0 ]], “D_R_IO_ms”:[[1313412960000 , 0 ],[1313413020000 , 0.16 ]], “D_R_NFS_sz”:[[1313412960000 , 0 ],[1313413020000 , 0 ]], “D_R_NFS_MB”:[[1313412960000 , 0 ],[1313413020000 , 0 ]], “D_R_IO_MB”:[[1313412960000 , 0.02 ],[1313413020000 , 0 ]], “vdb_names”:[“172.16.100.250_VVorc854″,”172.16.100.250_Vorc5DB”], “vdb_oscpu”:[0.06,0.11], “vdb_oracpu”:[0,0], “vdb_oracpuw”:[0.04,0.01], “vdb_read”:[0,0], “vdb_commit”:[0,0], “vdb_wait”:[0,0], “vdb_readskbt”:[0.02,0.2], “vdb_writeskbt”:[0.01,0.01], “vdb_o_readms”:[0.01,0.05], “vdb_o_writems”:[.007,10.705], “vdb_d_readms”:[0,0], “vdb_d_writems”:[616.99,616.99], “vdb_mxsum”:0.14}
This is also a simplified version of the original which was 30x bigger. I’ll give you one hint – all the braces, backets and quotes match up. Luckily I found a neat little web site:
http://jsonlint.com/
That I could copy and past the JSON into and voila there is the issue:
Parse error on line 202:
...writems": [        .007,        10.705
The decimal was missing a leading 0. The issue of decimals and decimal places brings me to another issue with highcharts. Highcharts is super cool jquery web graphing package that I’m investigating for use in a monitoring UI.
I did some prototyping with the example on http://www.highcharts.com/demo/dynamic-update and things would work just fine for a while, then all of a sudden the lines would disappear off the graph but the points would stay. Strange strange strange. I spent a day trying to debug . My debugging was a bit slow exacerbated by the fact that I know nothing about jquery. Well after a process of trial and error it turns out that if I sent numbers to my highcharts with more than 3 places after the decimal point then the lines would disappear. Not sure why, but after wrapping all my floats with
var = int( var * 100 )/ 100
everything runs flawlessly.
Being new to jquery, I found it useful have trace/debug output into the web page I was working on, but finding out how to debug was not obvious in jquery. Jquery, unlike perl seems to lack practical resources on the web, or at least if there are practical resources they are obfuscated by a large amount of less practical pages. Perl is quite different. With Perl if I type “perl debug” or “perl output” into google I get tons of great examples. If I type “jquery output” or “jquery debug” I get tons of pages with content that is close to what I want but no dice. These no dice URLs can cause me to spend a lot of my time trying to understand them. Most refer to using an alert for output which is a pain as every alert has to be acknowledged. Instead, as an easy solution, one can just create a region with the “div” tag as in
<div id=”debug” style=”width: 140px; height: 10px”> hello<br> </div>
and in jquery you can output to this region with
$(“#debug”).append(“hello again”);
Using this debug technique was nice as it enabled me to be able to check some of the values I was sending into the jquery code from the cgi which was quite useful since I was brand new to reading JSON with jquery and extracting variable values.
UPDATE:
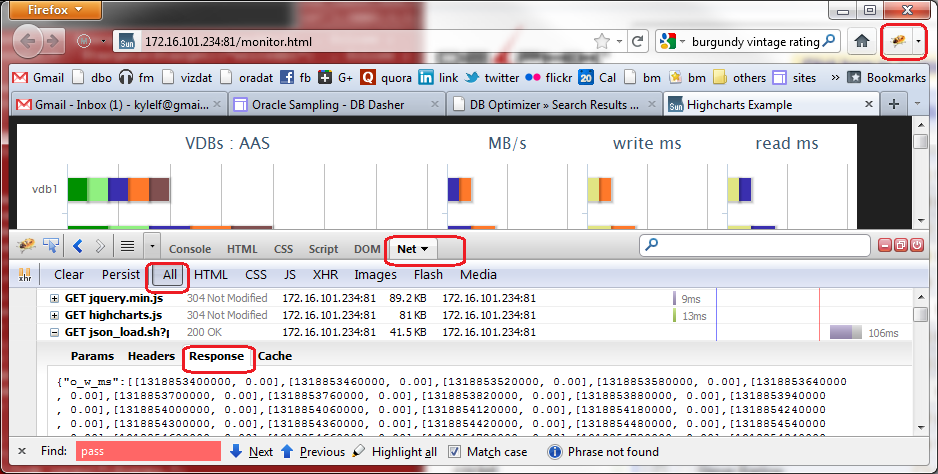
Just poking around the firebug data and found where I can see the JSON data I send the page, pretty cool:
Also checkout these cool call for debugging with firebug in firefox:
http://davidwalsh.name/firebug-console-log
You can also open “Tools -> Developer Tools” in Chrome or in IE hit F12 or menu “Developer Tools”
Followup:
Instead of outputting debug to the web page itself, just output it to the console log
function debug(data){
try { console.log(data); }
catch(e) { }
}
If the console log is not active in IE the console.log will give an error and the page won’t work, but if you open the console log then the page works. Sort of makes it hard to debug. By putting the console.log in a function and wraping it with a try the web page will work even when the console is not active.
Also under IE I had ajax calls the seem to stop working and/or deliver old values that were no longer possible. It turns out that IE was doing some kind of caching and that by adding a random number to the call, I would get the correct values:
function foo() {
$.ajax({
url: ‘/cgi-bin/foo’+’?rd=’+Math.random()
And a final thing under IE, is I’m using JSON a fair bit in my pages. Apparently before IE9 json2.js was not included and my pages simply hung on IE before 9. Trick was to get a local copy of json.js and include json2.js in the beginning of the page
<script type=”text/javascript” src=”json2.js”></script>


Trackbacks
Comments