SQL joins visualized in a surprising way
see more at: SQL tuning with VST
Saw a good posting on SQL joins today that echoes a classic image of SQL joins:
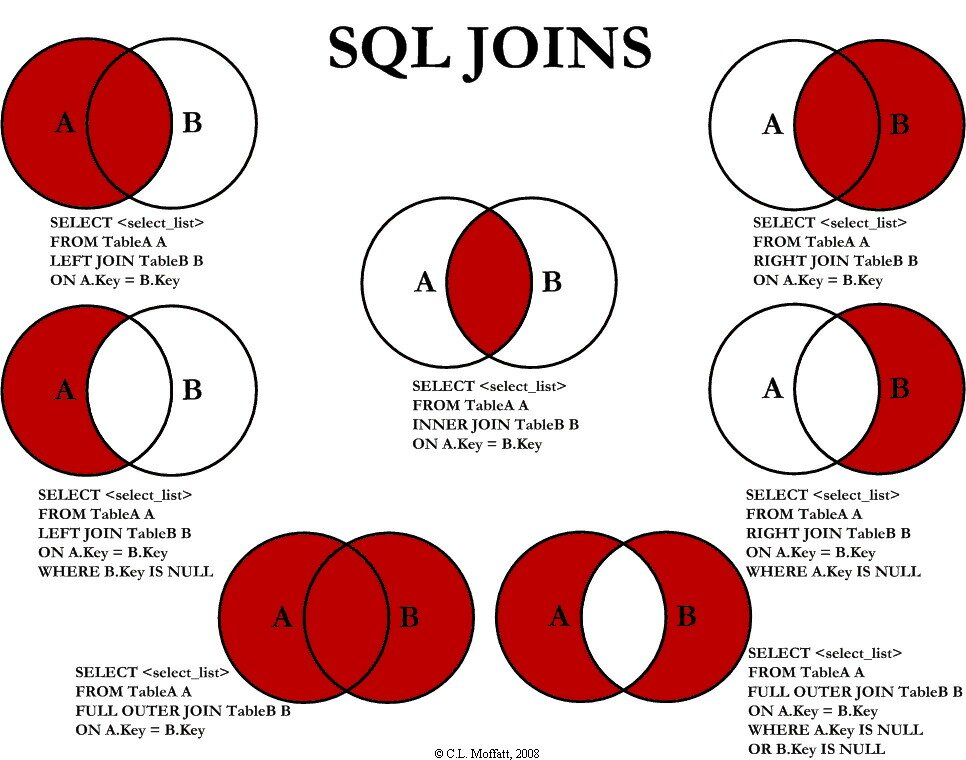
I loved this graphic when I first saw it. Seeing the graphic made me think “wow, I can actually wrap my mind around these crazy SQL joins.”
But there is more to SQL joins than meets the eye, at least in these pictures. These pictures leave out the effects of projection and amplification. For example, just taking the simplest case of a two table join (an inner join):
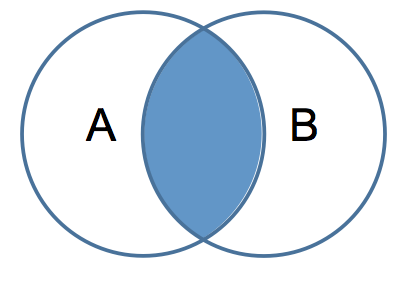
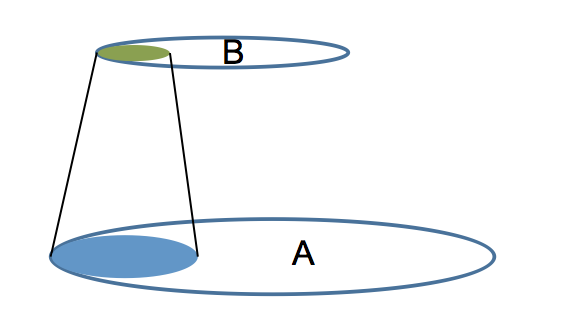
The intersection in the above graphic makes sense and looks simple, but to get a simple intersection requires that the two sets, the two tables, be related by one-to-one relationships. Let’s take a simple query to illustrate the point:
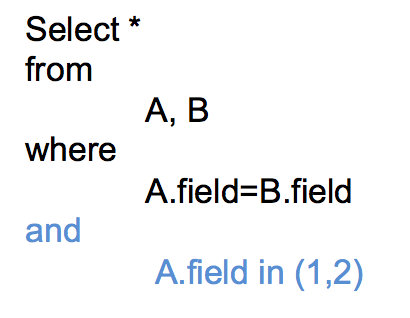
In the query we join tables A and B. In blue I’ve added a “predicate filter” which limits the rows that are joined.
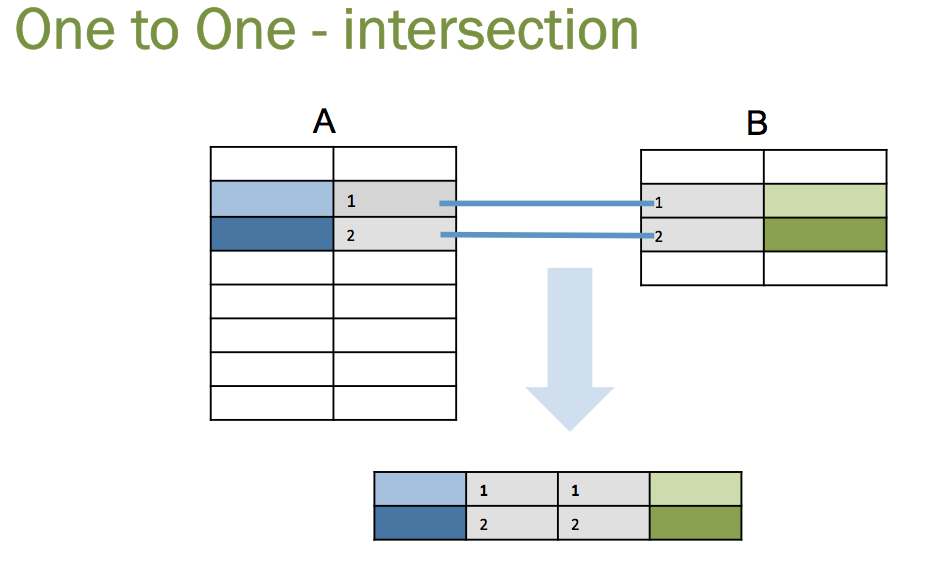
In a one to one relationship, for every value 1 in table A.field there will be one and only one value in table B.field. This is what the join diagram is showing, but how often do data models have one-to-one relationships? Sure it happens once in a while but the main relationship is one-to-many, which actually causes projections and not intersections.
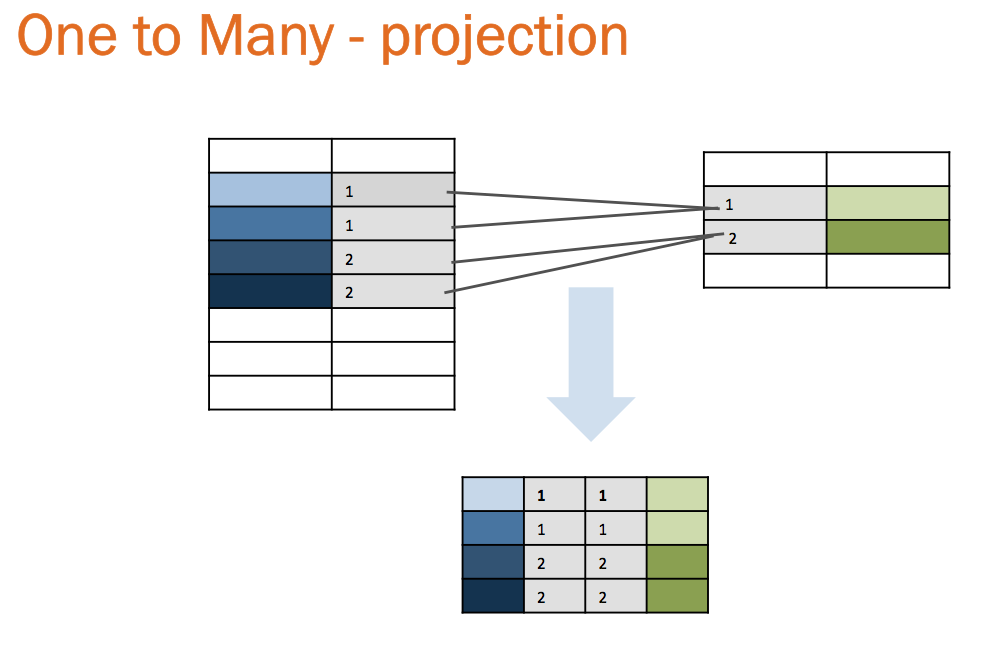
Most often tables are related by a one to many relationship, a parent to child relationship. For example one customer can have many orders, but each order pertains to one and only one customer. With one to many we no longer get the neat intersections of two circles but a “projection” of one set onto the other. The number of rows is limited by the maximum rows returned by the predicate filter in table A and B.
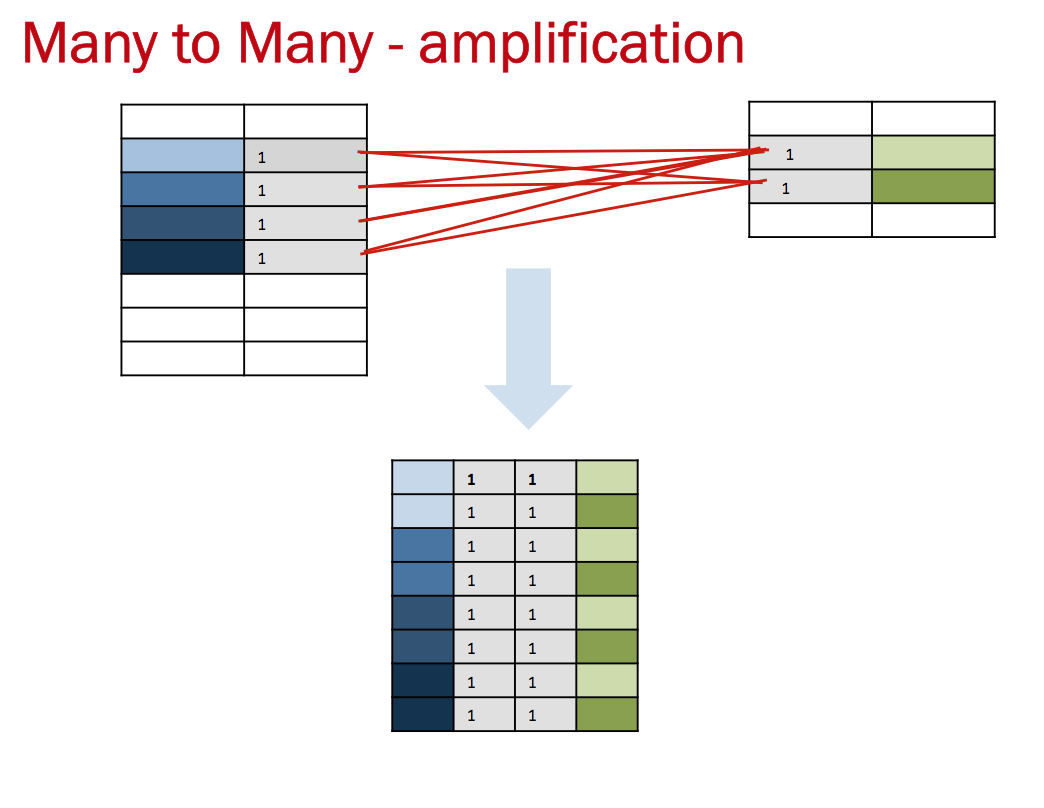
The most surprising case is amplification or multiplying of rows returned due to many-to-many relationships and thus illustrating part of the reason why many-to-many relationships are problematic
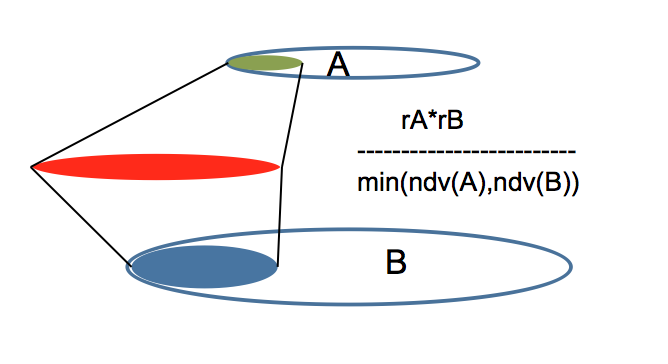
With many to many relationships, the maximum rows returned is the number of rows returned in A with the predicate filter multiplied by the number of rows in B returned after the predicate filter all divided by the minimum of the number of distinct values (NDV) returned on A or B after the predicate filter is applied.
In the above example that is (4*2)/ min(1,1) = 8
With more rows returned by either or both of table A and B, the effect can flood a query with rows to process.
All of this illustrates to me that SQL can be complex, more complex than the useful graphics at the top of the page would suggest.


Trackbacks
Comments