Woohoo: VST takes the next step
for more info see
- Visual SQL Tuning available in DB Optimizer $429 seat from Idera ( I have no association with Idera but I did design the product when working at Embarcadero where it was originally created)
- http://dboptimizer.com/db-optimizer/
- http://dboptimizer.com/tag/vst/
- http://docwiki.embarcadero.com/DBOptimizer/en/Analyzing_Results
- http://wiki.idera.com/display/SQLQT/Visual+SQL+Tuning
The new release of DB Optimizer , version 3.o, from Embarcadero has awesome new feature : explain plan overlay onto VST diagrams!
Let’s take an example query:
SELECT COUNT (*)
FROM   a,
       b,
       c
WHERE
       b.val2 = 100 AND
       a.val1 = b.id AND
       b.val1 = c.id;
There are indexes on b.id and c.id. Diagramming the query in DB Optimizer gives
The red lines with crows feet mean that as far as the definitions go, the relations could be many to many.
Question is “what is the optimal execution path for this query?”
One of the best execution plans is to
- start at the most selective filter table
- join to children if possible
- else join to parent
There is one filter in the diagram, represented by the green F on table B. Table B has a filter criteria in the query “b.val2=100”.
Ok, table B is where we start the query. Now where do we go from B? Who is the parent and who is the child? It’s not defined in the constraints nor indexes on these tables so it’s hard for us to know. Guess what ? It’s also hard for Oracle to figure it out. Well, what does Oracle decide to do? This is where the cool part of DB Optimizer 3.o comes in.
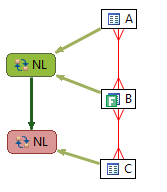
The super cool thing with DB Optimizer 3.0 is we can overlay the diagram with the actual execution path (I think this is so awesome)
For the digram we can see Oracle starts with B and joins to A. The result if this is joined to C. Is this the optimal path?
Well, let’s keep the same indexes and just add some constraints:
alter table c add constraint c_pk_con unique (id);
alter table b add constraint b_pk_con unique (id);
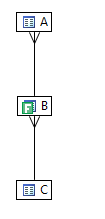
Now let’s diagram the query with DB Optimizer:
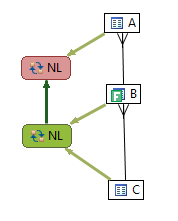
We can now see who the parent and child is, so we can determine the optimal query path which is to start at B, the only filter and join to the child C then to the parent A. Now what does Oracle do with the added constraint info:
Guess what? The execution plan has now changed with the addition of constraints and now Oracle’s execution path goes from a suboptimal plan to the optimal path. Moral of the story is to make sure and define constraint information because it helps the optimizer, but what I wanted to show here was the explain plan overlay on the diagram which makes comparing execution plans much easier. Putting the queries VST diagrams side by side along with the overlay of execution path we can clearly and quickly see the differences:
I plan to blog more about this awesome feature. It’s really cool.
Here is an example from an article by Jonathan Lewis
http://www.simple-talk.com/sql/performance/designing-efficient-sql-a-visual-approach/
The query Jonathan discusses is
SELECT order_line_data
FROM
         customers cus
         INNER JOIN
         orders ord
         ON ord.id_customer = cus.id
         INNER JOIN
         order_lines orl
         ON orl.id_order = ord.id
         INNER JOIN
         products prd1
         ON prd1.id = orl.id_product
         INNER JOIN
         suppliers sup1
         ON sup1.id = prd1.id_supplier
   WHERE
         cus.location = 'LONDON' AND
         ord.date_placed BETWEEN '04-JUN-10' AND '11-JUN-10' AND
         sup1.location = 'LEEDS' AND
    EXISTS (SELECT NULL
            FROM
                 alternatives alt
                 INNER JOIN
                 products prd2
                 ON prd2.id = alt.id_product_sub
                 INNER JOIN
                 suppliers sup2
                 ON sup2.id = prd2.id_supplier
           WHERE
                  alt.id_product = prd1.id AND
                  sup2.location != 'LEEDS')
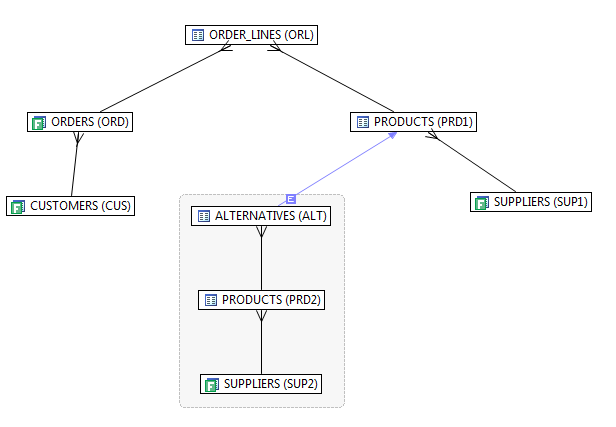
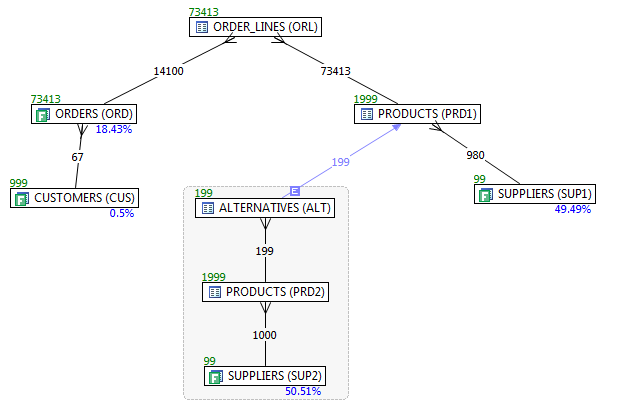
which diagrammed looks like
There are multiple filters, so we need to know which one is the most selective to know where to start, so we ask DB Optimizer to display the statistics as well (blue below a table is the filter %, green above is # of rows in table and numbers on join lines are rows returned by a join of just those two tables)
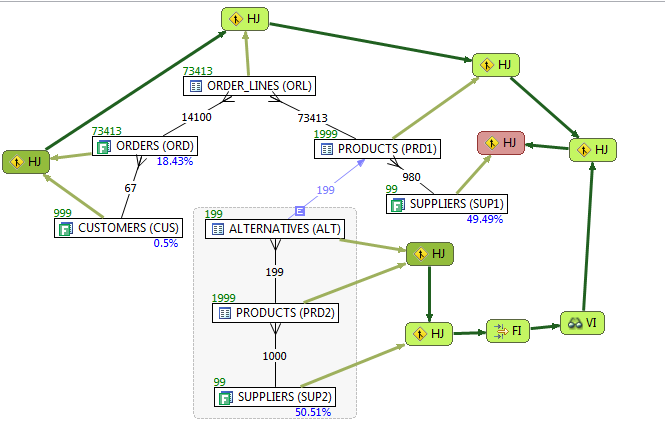
Now that we can determine a candidate for best optimization path, does Oracle take it?
Can you find the optimization error?
Dark green is where execution starts. There are two starts: one for the main query body and one for the subquery.
The red is where query execution ends.
( also see this older blog on the designing VST http://dboptimizer.com/2010/08/03/product-design-vst/ )
PS a big part of this work is by the lead developer Matt Vegh. Many thanks to Matt for this awesome work.
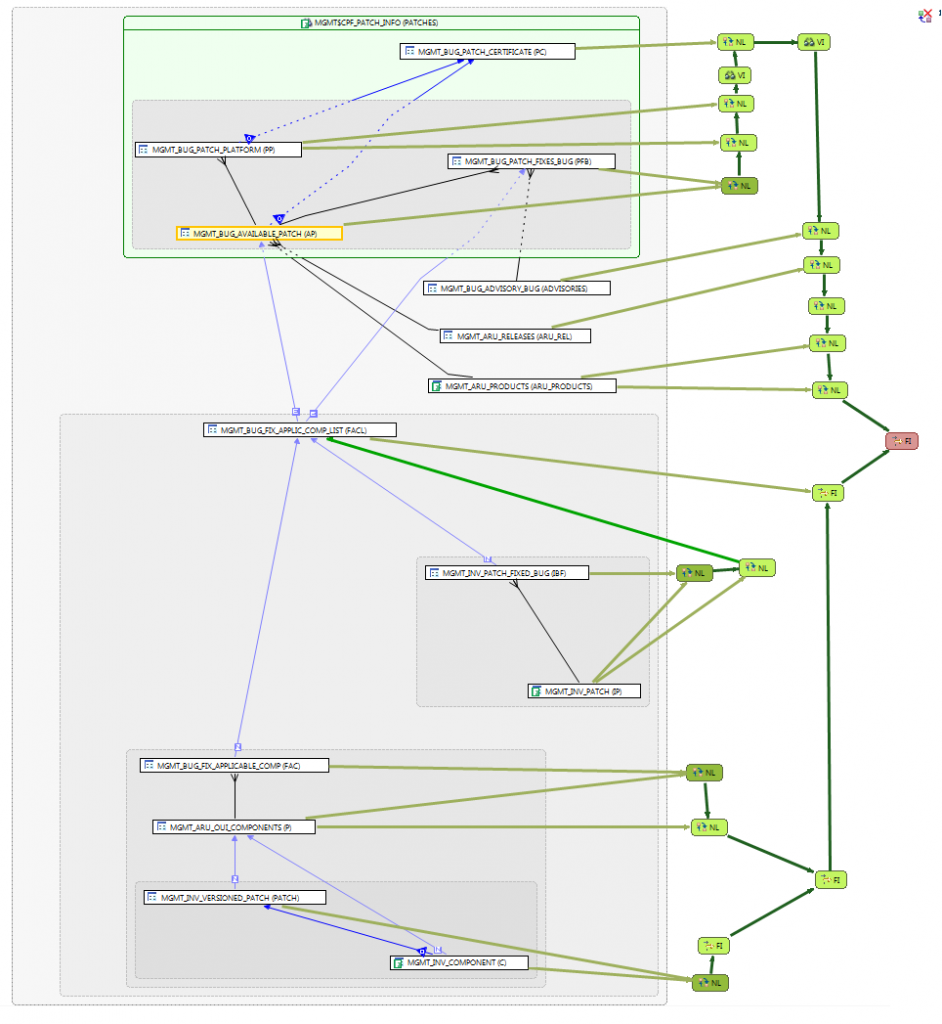
PPS another example from Karl Arao
The dark green nodes are starts, so there are 4 separate starts. We can see how the result sets from each start are joined with each successive table join set. The red is the final step.



Trackbacks
Comments
nice review at http://bradcorbin.net/2009/09/book-review-sql-tuning-by-dan-tow/
of “SQL Tuning” which was the inspiration for these diagramming ideas
discussion on stack overflow as to the best SQL books